
Question.1. The table below shows the marks obtained by 5 students in Science exam.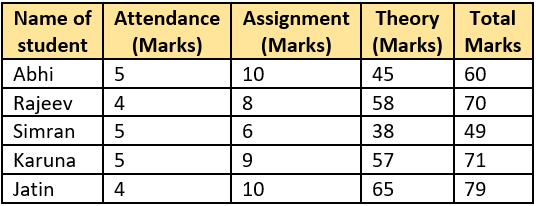
(a) Karuna
(b) Jatin
(c) Abhi
(d) Simran
Question.2. The table below shows the monthly expenditure of five factories: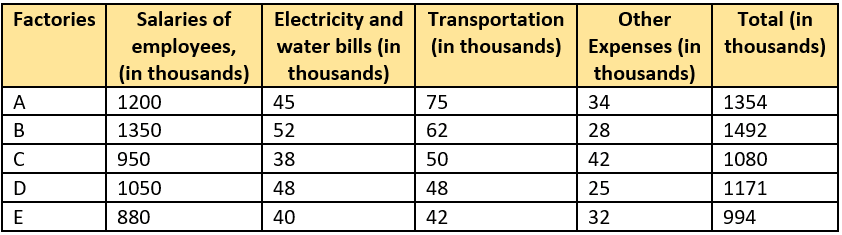
(a) The amount spent by factor A on transportation and other expenses is more than the amount spent by factory C.
(b) The amount spent by factory E on electricity and transportation is the same.
(c) Factory A spent an extra of Rs. 260 thousand than factory E.
(d) On transportation, Factory B spent the highest amount.
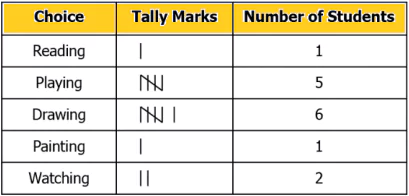
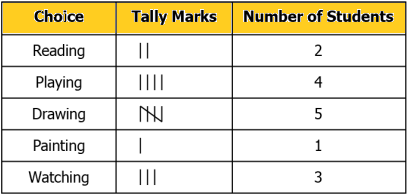
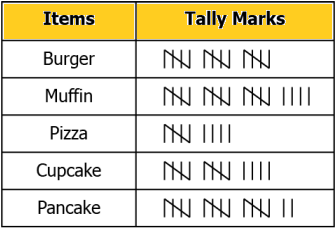
Question.5. A teacher asked students about the choice for their favorite past time. She recorded the data as:
Reading, Playing, Drawing, Reading, Playing, Playing, Painting, Drawing, Drawing, Watching, Drawing, Drawing, Playing, Watching, Drawing.
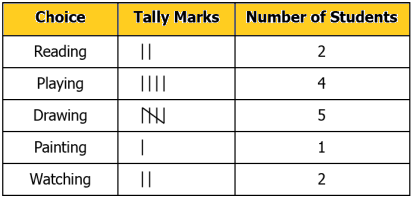
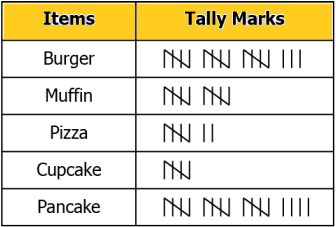
Which of the following option shows the representation of the information in the table using tally marks?
(a) 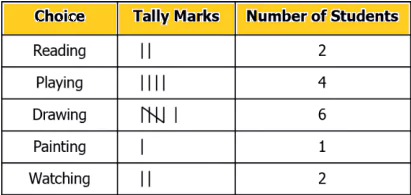
Question.6. A bakery owner records the sales of its items over an hour as shown below.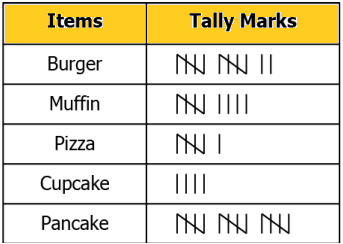
(a) 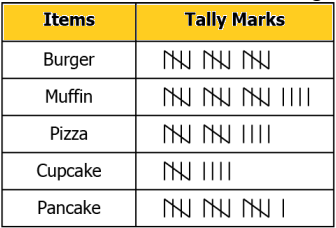
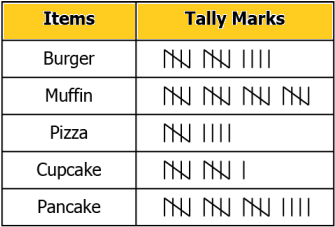
Ans.5. (a)
Question.7. The given pictograph shows the number of books sold at a bookshop over a week.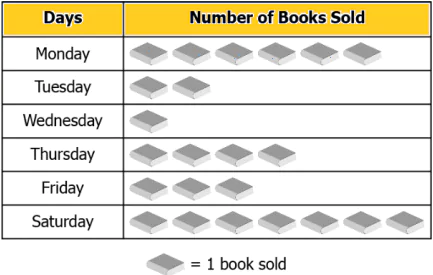
(a) Saturday
(b) Tuesday
(c) Monday
(d) Wednesday
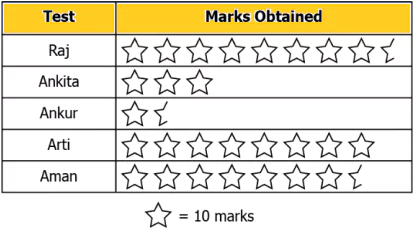
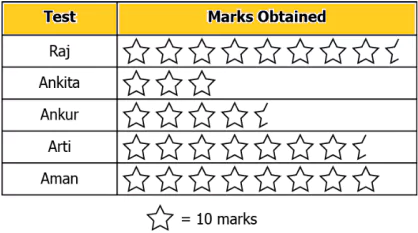
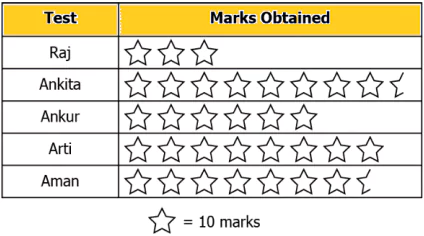
Question.8. A teacher made a pictograph which shows the marks obtained by 5 students in Math test out of 100.
She represents following information in the pictograph.
- Raj scored the maximum marks and Ankita scored the minimum marks.
- Ankur scored 15 marks more than Ankita.
- Arti scored 5 marks less than Aman.
Which of these pictographs could she have drawn?
(a) 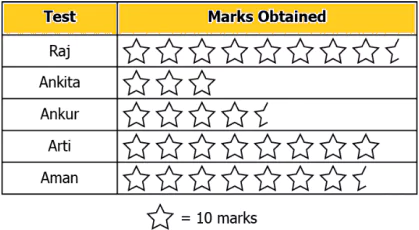
Ans.7. (d) Wednesday
Ans.8. (c)
Question.9. The pictograph shows the number of bouquets sold by a flower shop in the past 4 days.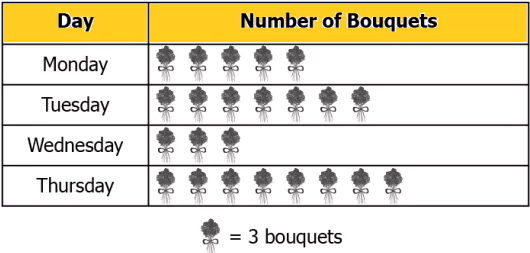
(a) 5
(b) 9
(c) 15
(d) 33
Question.10. A group of students were asked about their favourite instrument. A teacher represents the information in the pictograph shown.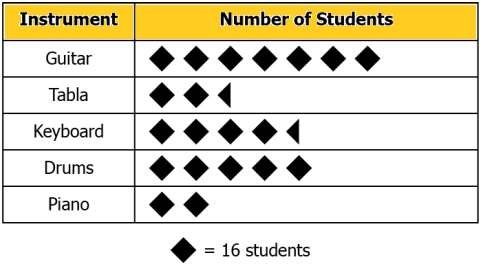
- More number of students prefer piano than Tabla
- Less number of students prefer Keyboard than Tabla
If the total number of students showing preference for the 3 instruments remains the same, which of these could be the number of students who prefer Piano, Tabla and Keyboard?
(a) Piano = 4, Tabla = 3 and Keyboard = 2
(b) Piano = 64, Tabla = 48 and Keyboard = 32
(c) Piano = 48, Tabla = 64 and Keyboard = 32
(d) Piano = 68, Tabla = 48 and Keyboard = 36
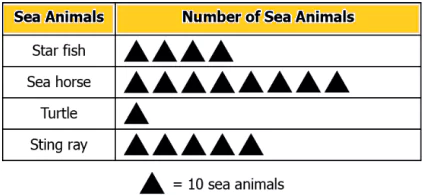
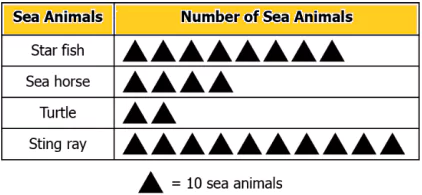
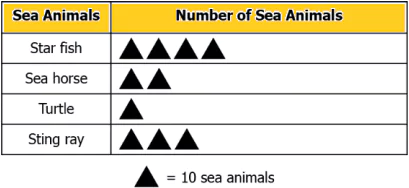
Question.11. The number of sea animals in a sea animal aquarium are as shown.
- There are 40 star fish.
- The number of sea horse is half the number of star fish.
- There are 10 turtles.
- The number of sting ray is 10 more than the number of star fish.
Which pictograph correctly represents the number of sea animals in the aquarium?
(a) 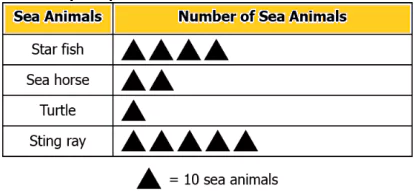
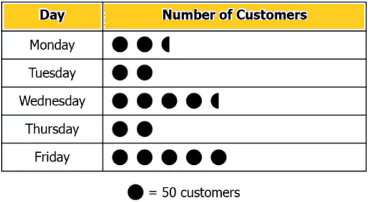
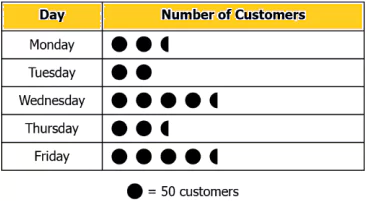
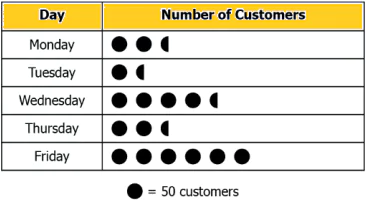
Question.12. The number of customers who visited a restaurant in the past 5 days is as shown.
- On Monday, 125 customers visited.
- The number of customers on Tuesday and Thursday is the same.
- On Wednesday, 100 more customers visited than on Monday.
- On Friday, the maximum number of customers visited.
Which of these can be the pictograph correctly representing the number of customers?
(a) 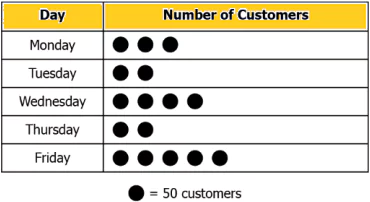
Ans.11. (a)
Question.13. The given bar graph shows the number of fruits sold by the fruit vendor in the last two weeks.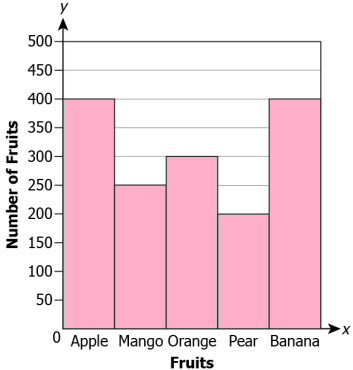
(a) 150
(b) 250
(c) 400
(d) 650
Question.14. The bar graph shows the sales of candles in a fair in last five weeks.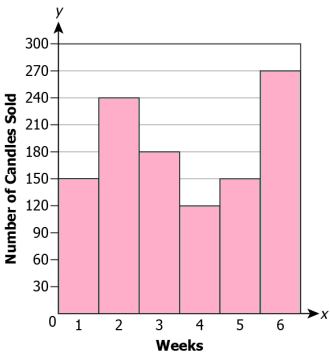
(a) In odd number of weeks 150 less candles were sold than in even number of weeks.
(b) In the first three weeks 20 more candles were sold than in the last three weeks.
(c) In week 1, 120 more candles were sold than in week 6.
(d) A total of 1010 candles were sold in 6 weeks.
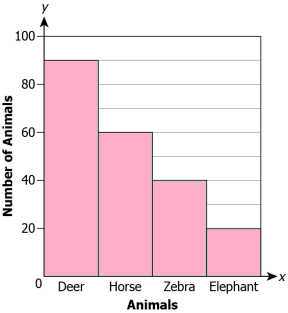
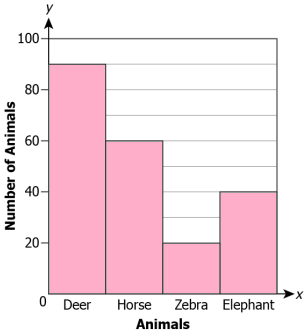
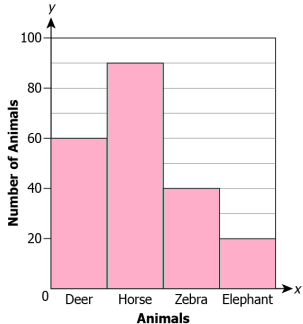
Question.15. The table below shows the number of animals in a zoo.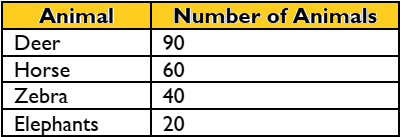
(a) 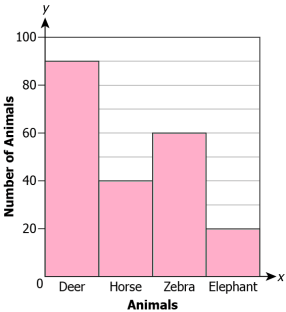
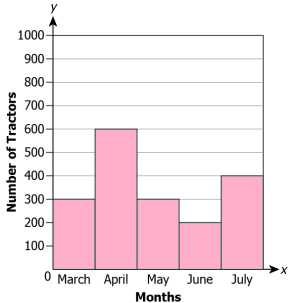
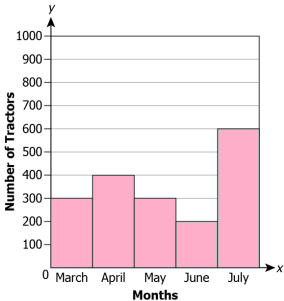
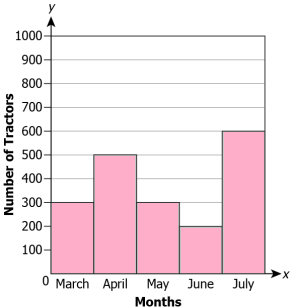
Question.16. The number of tractors sold in the past 5 months by a company is as shown.
- The number of tractors sold in March was 300.
- The number of tractors sold in May were the same as in March.
- The number of tractors sold in April was more than that in June.
- The maximum number of tractors were sold in July.
Given that the total number of tractors sold were 1800, which bar graph correctly represents the information?
(a) 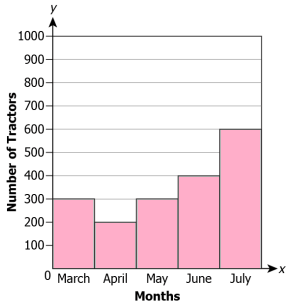
Ans.15. (b)
Question.17. The bar graph below shows the genres of movies preferred by a group of students.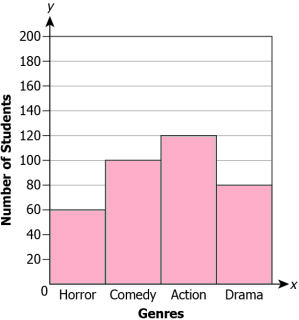
(a) 1
(b) 20
(c) 40
(d) 60
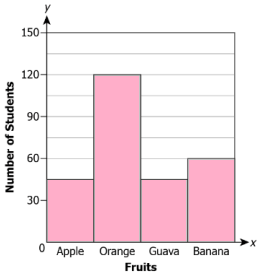
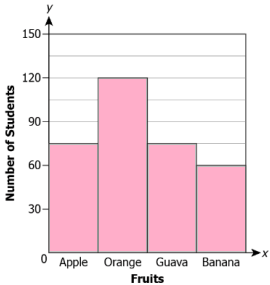
Question.18. Palak records the favourite fruit of a group of 330 students in the bar graph shown.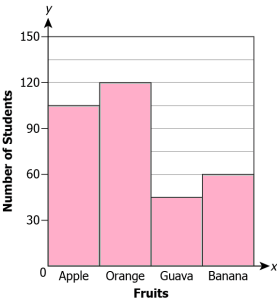
(a) 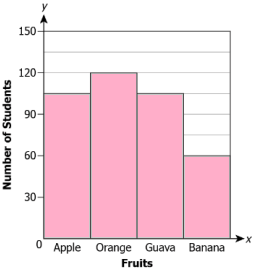

Ans.17. (b) 20
Ans.18. (c)


