
NCERT Exemplar Class 10 Maths Chapter 13 Statistics and Probability Solutions (CBSE 2026-27)
This post covers in-syllabus NCERT Exemplar questions strictly based on the rationalised curriculum: Mean, Median, and Mode of grouped data, converting cumulative frequency distributions, and classical probability of elementary and compound events. Questions involving Graphical representation of cumulative frequency distributions (Ogive curves) have been rationalised and removed.
Exercise 13.1: Multiple Choice Questions (MCQs)
To determine the median of grouped data, we find the median class by locating \(\frac{n}{2}\) in the cumulative frequency column. Hence, cumulative frequency tables are directly used for computing the median.
| Monthly income range (in Rs) | Number of families |
|---|---|
| More than Rs 10000 | 100 |
| More than Rs 13000 | 85 |
| More than Rs 16000 | 69 |
| More than Rs 19000 | 50 |
| More than Rs 22000 | 33 |
| More than Rs 25000 | 15 |
Number of families having income more than Rs 16000 \(= 69\).
Number of families having income more than Rs 19000 \(= 50\).
\[\text{Frequency of } (16000 – 19000) = 69 – 50 = 19\]| Height (in cm) | 150–155 | 155–160 | 160–165 | 165–170 | 170–175 | 175–180 |
|---|---|---|---|---|---|---|
| Number of students | 15 | 13 | 10 | 8 | 9 | 5 |
The maximum frequency is \(15\) in class \(150 – 155\). Modal class \(= 150 – 155\) \(\implies\) lower limit \(= 150\).
Total \(n = 60 \implies \frac{n}{2} = 30\). Cumulative frequencies are: \(15, 28, 38, 46, 55, 60\). The class with cumulative frequency just greater than \(30\) is \(160 – 165\). Upper limit of median class \(= 165\).
\[\text{Sum} = 150 + 165 = 315\]For any event \(E\), \(0 \le P(E) \le 1\). Here, \(\frac{18}{23} \approx 0.783\), which lies in \([0, 1]\). Options (A) is negative, and (B) and (D) are \(> 1\).
Total cards \(= 52\). Number of face cards (Kings, Queens, Jacks) \(= 4 \times 3 = 12\):
\[P(\text{face card}) = \frac{12}{52} = \frac{3}{13}\]Total balls \(= 3 + 5 + 7 = 15\). A ball that is neither red nor black must be white (\(5\) balls):
\[P(\text{white}) = \frac{5}{15} = \frac{1}{3}\]By definition, \(d_i = x_i – a\), where \(x_i\) is the class mark (mid-point of the \(i^{\text{th}}\) class) and \(a\) is the assumed mean.
In grouped data, each observation inside a class is represented by its mid-point or class mark \(x_i\).
From the definition of mean, \(\bar{x} = \frac{\sum f_i x_i}{N} \implies \sum f_i x_i = N \bar{x} = \sum f_i \bar{x}\). Therefore, \(\sum f_i (x_i – \bar{x}) = 0\).
In the step-deviation method, the step deviation variable is defined as \(u_i = \frac{x_i – a}{h}\).
| Class | 0–5 | 5–10 | 10–15 | 15–20 | 20–25 |
|---|---|---|---|---|---|
| Frequency | 10 | 15 | 12 | 20 | 9 |
Maximum frequency is \(20\) in class \(15 – 20\). Lower limit of modal class \(= 15\).
Total \(n = 10 + 15 + 12 + 20 + 9 = 66 \implies \frac{n}{2} = 33\). Cumulative frequencies are \(10, 25, 37, 57, 66\). The median class is \(10 – 15\), whose lower limit is \(10\).
\[\text{Sum} = 15 + 10 = 25\]| Class | 0–5 | 6–11 | 12–17 | 18–23 | 24–29 |
|---|---|---|---|---|---|
| Frequency | 13 | 10 | 15 | 8 | 11 |
Making class intervals continuous: \(-0.5 – 5.5, 5.5 – 11.5, 11.5 – 17.5, 17.5 – 23.5, 23.5 – 29.5\).
Total \(n = 13 + 10 + 15 + 8 + 11 = 57 \implies \frac{n}{2} = 28.5\). Cumulative frequencies: \(13, 23, 38, 46, 57\). The median class is \(11.5 – 17.5\). Its upper limit is \(17.5\).
| Marks | Below 10 | Below 20 | Below 30 | Below 40 | Below 50 | Below 60 |
|---|---|---|---|---|---|---|
| Number of students | 3 | 12 | 27 | 57 | 75 | 80 |
Converting to individual class frequencies:
- \(0 – 10: 3\)
- \(10 – 20: 12 – 3 = 9\)
- \(20 – 30: 27 – 12 = 15\)
- \(30 – 40: 57 – 27 = 30\)
- \(40 – 50: 75 – 57 = 18\)
- \(50 – 60: 80 – 75 = 5\)
The maximum frequency is \(30\) in class \(30 – 40\). Hence, the modal class is \(30 – 40\).
| Class | 65–85 | 85–105 | 105–125 | 125–145 | 145–165 | 165–185 | 185–205 |
|---|---|---|---|---|---|---|---|
| Frequency | 4 | 5 | 13 | 20 | 14 | 7 | 4 |
Modal class has maximum frequency \(20 \implies 125 – 145\). Lower limit \(= 125\).
\(n = 67 \implies \frac{n}{2} = 33.5\). Cumulative frequencies: \(4, 9, 22, 42, 56, 63, 67\). Median class is \(125 – 145\) \(\implies\) upper limit \(= 145\).
\[\text{Difference} = 145 – 125 = 20\]| Class | 13.8–14 | 14–14.2 | 14.2–14.4 | 14.4–14.6 | 14.6–14.8 | 14.8–15 |
|---|---|---|---|---|---|---|
| Frequency | 2 | 4 | 5 | 71 | 48 | 20 |
Athletes with time \(< 14.6\text{ s}\) belong to the first four intervals:
\[2 + 4 + 5 + 71 = 82\]| Marks obtained | Number of students |
|---|---|
| \(\ge 0\) | 63 |
| \(\ge 10\) | 58 |
| \(\ge 20\) | 55 |
| \(\ge 30\) | 51 |
| \(\ge 40\) | 48 |
| \(\ge 50\) | 42 |
An event that is impossible has probability exactly \(0\).
Since \(\frac{17}{16} > 1\), it cannot be the probability of any event.
A smaller non-negative value closest to \(0\) corresponds to an event least likely to occur.
Since \(P(E) + P(\bar{E}) = 1\), \(P(\bar{E}) = 1 – p\).
Probability ranges from \(0\%\) to \(100\%\). It can never be negative (\(< 0\)).
There are 6 red face cards (3 hearts + 3 diamonds):
\[P(\text{red face card}) = \frac{6}{52} = \frac{3}{26}\]A non-leap year has 365 days \(= 52\text{ weeks} + 1\text{ extra day}\). The extra day can be any of the 7 days of the week:
\[P(53\text{ Sundays}) = \frac{1}{7}\]Sample space \(= \{1, 2, 3, 4, 5, 6\}\). Favourable outcome is only \(\{1\}\):
\[P = \frac{1}{6}\]There is only 1 ace of hearts in the deck. Favourable outcomes \(= 52 – 1 = 51\).
Multiples of 5 between 1 and 40 are \(5, 10, 15, 20, 25, 30, 35, 40\) (8 numbers):
\[P = \frac{8}{40} = \frac{1}{5}\]There are exactly 25 prime numbers between 1 and 100:
\[P = \frac{25}{100} = \frac{1}{4}\]Students from A, B, C \(= 4 + 8 + 5 = 17\). Students not from A, B, C \(= 23 – 17 = 6\):
\[P = \frac{6}{23}\]Exercise 13.2: Short Answer Questions with Reasoning
When grouping data, we assume observations in the median class are uniformly distributed. Grouping causes a loss of individual data values, so grouped median is an approximation and rarely equals ungrouped median exactly.
Mathematically, \(a\) can be any real number. We usually choose a class mark near the middle simply to minimize arithmetic calculations.
For a perfectly symmetric distribution, the mean, median, and mode coincide and are equal.
They can be identical. For example, in many symmetric or unimodal distributions, the class with the highest frequency also contains the \(\frac{n}{2}^{\text{th}}\) observation.
The total possible elementary outcomes are \(2^3 = 8\): \(\{BBB, BBG, BGB, BGG, GBB, GBG, GGB, GGG\}\). The four outcomes (0, 1, 2, 3 girls) have probabilities \(\frac{1}{8}, \frac{3}{8}, \frac{3}{8}, \frac{1}{8}\) respectively, and are not equally likely.
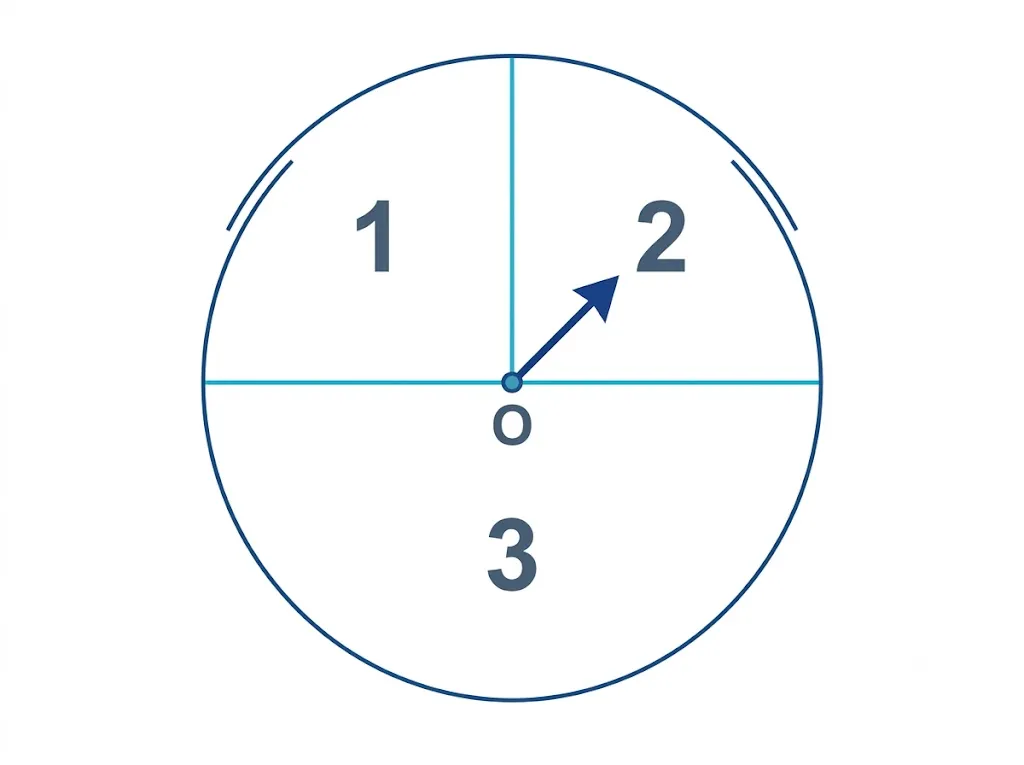
Regions 1 and 2 each have central angle \(90^\circ\) (\(\text{area} = \frac{1}{4}\) circle), while region 3 has central angle \(180^\circ\) (\(\text{area} = \frac{1}{2}\) circle). Since the area of region 3 is twice that of 1 or 2, outcomes are not equally likely.
For Apoorv (2 dice, 36 outcomes): product is 36 only for \((6, 6)\):
\[P(\text{Apoorv}) = \frac{1}{36}\]For Peehu (1 die, 6 outcomes): square is 36 only for \(\{6\}\):
\[P(\text{Peehu}) = \frac{1}{6} = \frac{6}{36} > \frac{1}{36}\]Because an unbiased coin has symmetrical faces, landing on Head or Tail are mutually exclusive and equally likely outcomes, each with probability \(\frac{1}{2}\).
The outcomes ‘1’ and ‘not 1’ are not equally likely:
\[P(1) = \frac{1}{6}, \quad P(\text{not } 1) = \frac{5}{6}\]These four compound events are not equally likely. Total elementary outcomes \(= 8\). No heads occurs only as \(\{TTT\}\) (\(1\) outcome), so the correct probability is \(\frac{1}{8}\), not \(\frac{1}{4}\).
Coin tosses are independent events. The coin has no memory of past outcomes; the probability of getting Heads or Tails on any single fair toss remains strictly \(\frac{1}{2}\).
Exercise 13.3: Numerical Problems (Mean, Median, Mode & Probability)
| Class | 1–3 | 3–5 | 5–7 | 7–10 |
|---|---|---|---|---|
| Frequency (\(f_i\)) | 9 | 22 | 27 | 17 |
| Class | \(x_i\) | \(f_i\) | \(f_i x_i\) |
|---|---|---|---|
| 1–3 | 2 | 9 | 18 |
| 3–5 | 4 | 22 | 88 |
| 5–7 | 6 | 27 | 162 |
| 7–10 | 8.5 | 17 | 144.5 |
| Total | 75 | 412.5 |
| Marks | 10–20 | 20–30 | 30–40 | 40–50 | 50–60 |
|---|---|---|---|---|---|
| Students (\(f_i\)) | 4 | 2 | 7 | 6 | 1 |
| Mileage (km/l) | 10–12 | 12–14 | 14–16 | 16–18 |
|---|---|---|---|---|
| Number of cars (\(f_i\)) | 7 | 12 | 18 | 13 |
Conclusion: No, we do not agree with the claim of \(16\text{ km/l}\), as average mileage is only \(14.48\text{ km/l}\).
| Weekly Income (in Rs) | 0–1000 | 1000–2000 | 2000–3000 | 3000–4000 | 4000–5000 | 5000–6000 |
|---|---|---|---|---|---|---|
| Families | 250 | 190 | 100 | 40 | 15 | 5 |
\(n = 600 \implies \frac{n}{2} = 300\). Cumulative frequencies: \(250, 440, 540, 580, 595, 600\).
Median class is \(1000 – 2000\): \(l = 1000, cf = 250, f = 190, h = 1000\).
\[\text{Median} = l + \left(\frac{\frac{n}{2} – cf}{f}\right)h = 1000 + \left(\frac{300 – 250}{190}\right) \times 1000 = 1000 + \frac{50000}{190} \approx \mathbf{\text{Rs } 1263.16}\]| Income (in Rs) | 0–5000 | 5000–10000 | 10000–15000 | 15000–20000 | 20000–25000 | 25000–30000 | 30000–35000 | 35000–40000 |
|---|---|---|---|---|---|---|---|---|
| Families | 8 | 26 | 41 | 16 | 3 | 3 | 2 | 1 |
Maximum frequency is \(41\) in class \(10000 – 15000\):
\(l = 10000, f_1 = 41, f_0 = 26, f_2 = 16, h = 5000\).
\[\text{Mode} = l + \left(\frac{f_1 – f_0}{2f_1 – f_0 – f_2}\right) \times h = 10000 + \left(\frac{41 – 26}{82 – 26 – 16}\right) \times 5000\] \[= 10000 + \left(\frac{15}{40}\right) \times 5000 = 10000 + 1875 = \mathbf{\text{Rs } 11875}\](i) same number on both dice.
(ii) different numbers on both dice.
Total outcomes \(= 36\).
(i) Same numbers (doublets): \(\{(1,1), (2,2), (3,3), (4,4), (5,5), (6,6)\}\) (6 outcomes):
\[P = \frac{6}{36} = \mathbf{\frac{1}{6}}\](ii) Different numbers:
\[P = 1 – \frac{1}{6} = \mathbf{\frac{5}{6}}\]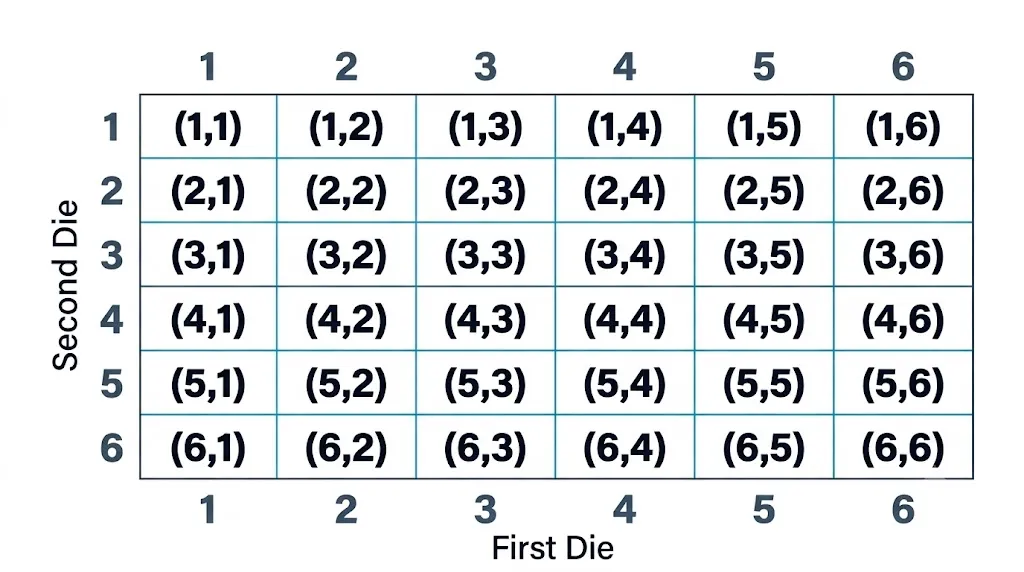
(i) Sum = 7: \(\{(1,6), (2,5), (3,4), (4,3), (5,2), (6,1)\}\) (6 outcomes) \(\implies P = \frac{6}{36} = \mathbf{\frac{1}{6}}\).
(ii) Sum is prime (2, 3, 5, 7, 11):
- Sum 2: (1,1) \(\to 1\)
- Sum 3: (1,2), (2,1) \(\to 2\)
- Sum 5: (1,4), (2,3), (3,2), (4,1) \(\to 4\)
- Sum 7: 6 outcomes
- Sum 11: (5,6), (6,5) \(\to 2\)
Total favourable \(= 1 + 2 + 4 + 6 + 2 = 15 \implies P = \frac{15}{36} = \mathbf{\frac{5}{12}}\).
(iii) Sum = 1: Minimum sum is \(2\). This is an impossible event \(\implies P = \mathbf{0}\).
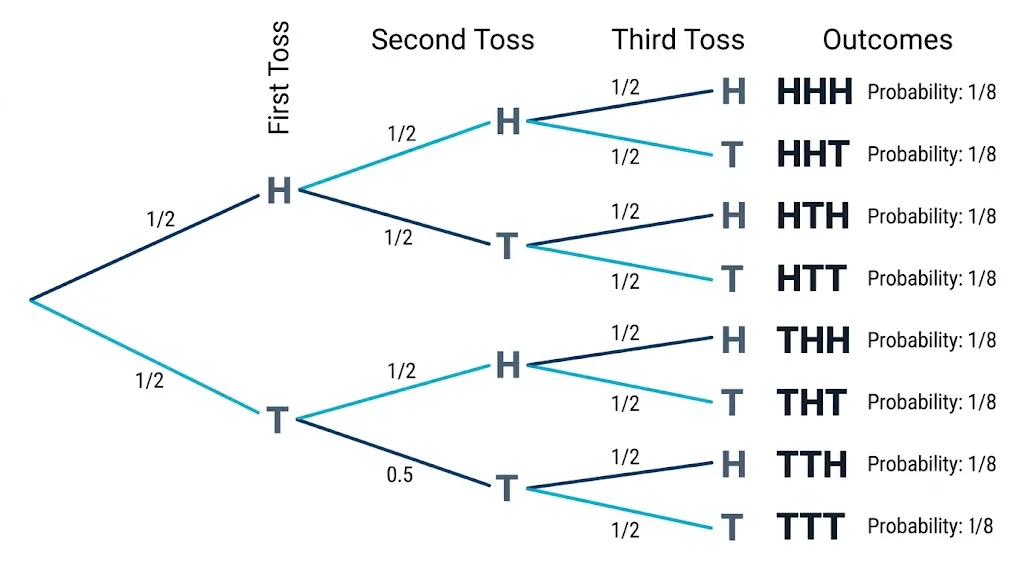
Sample space \(S = \{HHH, HHT, HTH, HTT, THH, THT, TTH, TTT\}\) (Total \(= 8\)).
(i) All heads: \(\{HHH\} \implies P = \mathbf{\frac{1}{8}}\).
(ii) At least 2 heads: \(\{HHH, HHT, HTH, THH\}\) (4 outcomes) \(\implies P = \frac{4}{8} = \mathbf{\frac{1}{2}}\).
Remaining cards \(= 52 – 3 = 49\).
(i) A heart: All 13 hearts remain \(\implies P = \mathbf{\frac{13}{49}}\).
(ii) A king: 3 kings remain (spade, heart, diamond) \(\implies P = \mathbf{\frac{3}{49}}\).
(iii) A club: \(13 – 3 = 10\) clubs remain \(\implies P = \mathbf{\frac{10}{49}}\).
Total outcomes \(= 8\).
(i) Loses (0 heads, i.e., TTT): \(1\) outcome \(\implies P = \mathbf{\frac{1}{8}}\).
(ii) Gets double (3 heads, i.e., HHH): \(1\) outcome \(\implies P = \mathbf{\frac{1}{8}}\).
(iii) Just gets fee back (1 or 2 heads): \(6\) outcomes \(\implies P = \frac{6}{8} = \mathbf{\frac{3}{4}}\).
Red \(= 4\), White \(= 8\), Blue \(= 12\).
(i) Not red (white or blue = 20 balls):
\[P(\text{not red}) = \frac{20}{24} = \mathbf{\frac{5}{6}}\](ii) White (8 balls):
\[P(\text{white}) = \frac{8}{24} = \mathbf{\frac{1}{3}}\]