
Question.2. Answer the following questions in about 30 words:
(i) Define the mean.
Answer. The mean is the result of adding all the values together and dividing by the number of observations.
\overline{X} = \frac{Sum of observations}{No. of observations}
(ii) What are the advantages of using mode?
Answer. The highest occurrence or frequency at a certain location or value is known as the mode. The most significant benefit of the mode is that it is unaffected by extreme values. Even open-ended series can be defined.
Question.3. Answer the following questions in about 125 words:
(i) Explain relative positions of mean, median and mode in a normal distribution and skewed distribution with the help of diagrams.
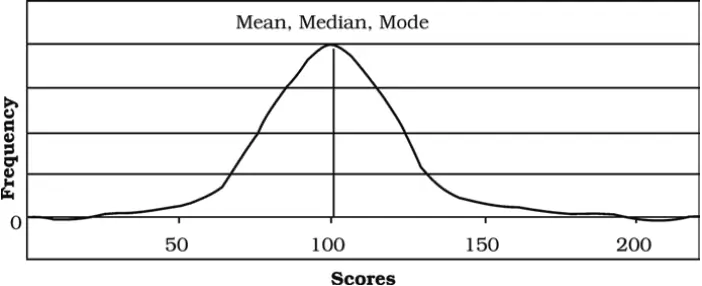
Answer. (a) Normal Curve: The maximum frequency occurs in the centre of this curve, and both the left and right tails are identical. It’s a unimodal curve with the same mean, median, and mode. A bell shaped or symmetrical curve is another name for it. It is as follows:
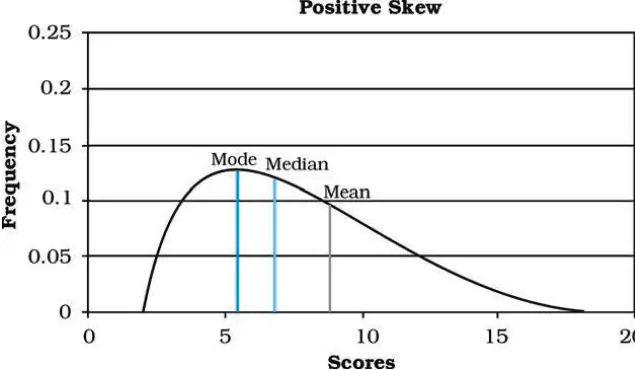
(b) Positively Skewed Curve: This is a symmetrical curve with a tail on the right hand side of the graph and higher frequencies for lower data values. The curve is on the left side of the distribution in these histograms. The majority of the distribution is concentrated on the left if the right tail is longer. It has a small number of low values. It is as follows:
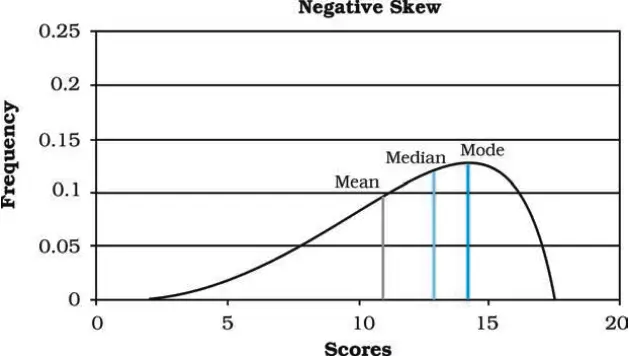
(c) Negatively Skewed Curve: This is a symmetrical curve with a tail on the left side of the graph and greater frequencies for higher data values. The left tail is longer, and the distribution’s bulk is concentrated on the figure’s right side. It has a small number of low values. The distribution is biassed to the left. It is as follows:
(ii) Comment on the applicability of mean, median and mode (hint: from their merits and demerits).
Answer. Mean:
- It is the most basic of all the central tendency measurements.
- It is based on the entire sequence of things. As a result, it represents the value of various items.
- It is a value. There is no provision for estimated values.
- It is a type of core tendency that is stable.
- It can be used as a comparison.
Median:
- The extreme values in the series have little effect on the median.
- Only the middle values and their units are needed to get the median.
- Data can also be represented graphically to find the median.
- In a series, the median value is always known.
Mode:
- The mode is a simple measure of central tendency.
- Extreme and marginal values have less of an impact.
- The finest portrayal of the series is mode.
- It may be calculated graphically as well.


