
Question.1. Vinod records the ages (in years) of people in a central park as shown below.
7, 12, 18, 16, 6, 9, 11, 21, 24, 35, 38, 52, 58, 60, 45, 55, 8, 10, 15, 12, 39, 44, 10, 5, 19, 31, 29, 48, 50, 16.
Which of the frequency tables correctly represents the data with a class size of 8?
(a) 


Question.2. Riya measured the heights of the plants in her backyard and recorded the data as shown below.
58.5 cm, 62 cm, 68.1 cm, 52.3 cm, 81.6 cm, 72.5 cm, 69.5 cm, 70.5 cm, 54.1 cm, 55.5 cm, 85.5 cm, 78.3 cm, 82.9 cm, 74.2 cm, 86 cm
She then incorrectly created a frequency table of the data collected as shown below.

Which of these could be the possible reason of error in Riya’s frequency table?
(a) 70.5 cm and 85.5 cm must be considered in class (70.5 – 75.5) and class (85.5 – 90.5) respectively, and not in class (65.5 – 70.5) and class (80.5 – 85.5).
(b) 70.5 cm and 85.5 cm must be considered in class (65.5 – 70.5), class (50.5 – 55.5), and class (80.5 – 85.5) respectively, and not in class (70.5 – 75.5) and class (85.5 – 90.5).
(c) 70.5 cm, 55.5 cm, 85.5 cm must be considered in class (70.5 – 75.5), class (55.5 – 60.5), and class (85.5 – 90.5) respectively, and not in class (65.5 – 70.5), class (50.5 – 55.5), and class (80.5 – 85.5).
(d) 70.5 cm, 55.5 cm, 85.5 cm must be considered in class (65.5 – 70.5), class (50.5 – 55.5), and class (80.5 – 85.5) respectively, and not in class (70.5 – 75.5), class (55.5 – 60.5), and class (85.5 – 90.5).
Ans.1. (c)
Question.3. A student recorded the population of some villages as shown below.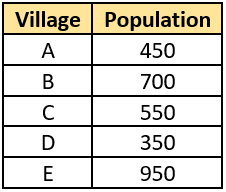
(a) 1 unit = 10 people
(b) 1 unit = 50 people
(c) 1 unit = 100 people
(d) 1 unit = 500 people
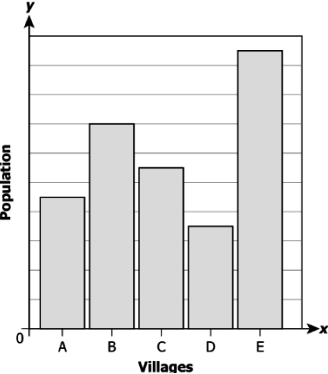
Question.4. The bar graph below shows the number of students residing at different hostel buildings in a university.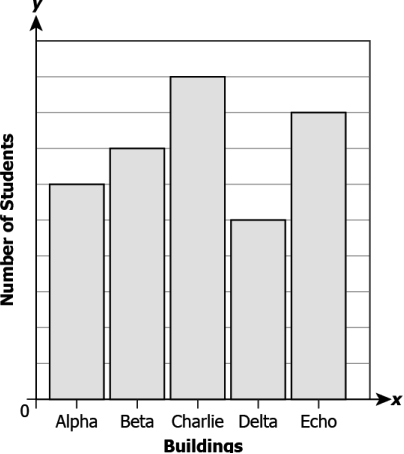
(a) 90
(b) 135
(c) 180
(d) 225
Question.5. The bar graph below shows the number of sea animals in a large aquarium.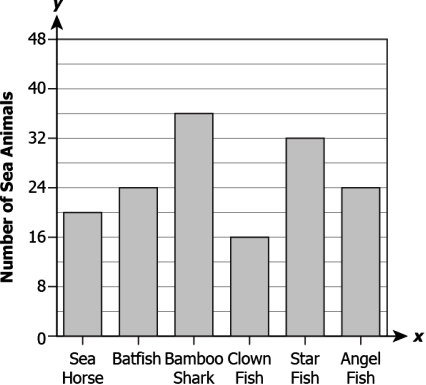
(a) 2
(b) 4
(c) 6
(d) 8
Question.6. The bar graph shows the annual income of a group of friends.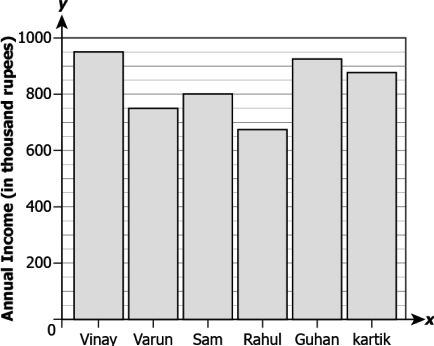
(a) Vinay; Rs 200000
(b) Vinay; Rs 275000
(c) Guhan; Rs 175000
(d) Guhan; Rs 250000
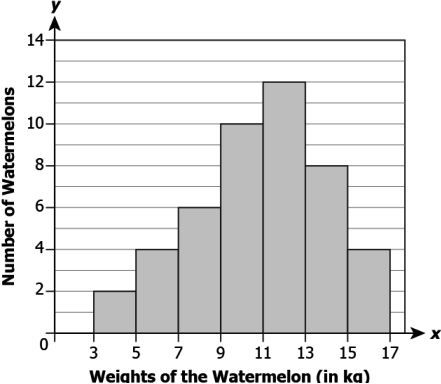
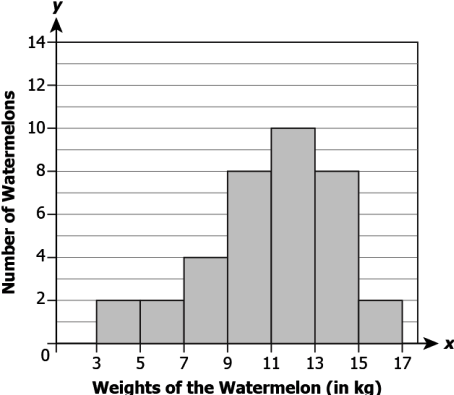
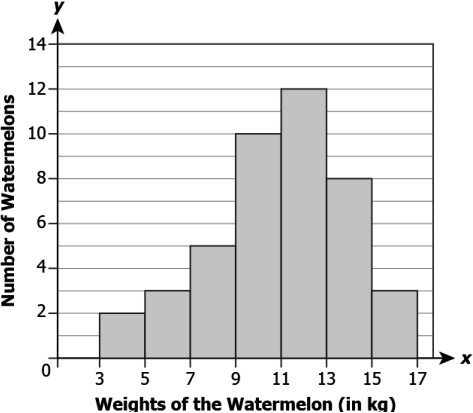
Question.7. The table below show the weights of watermelons at a store.
(a) 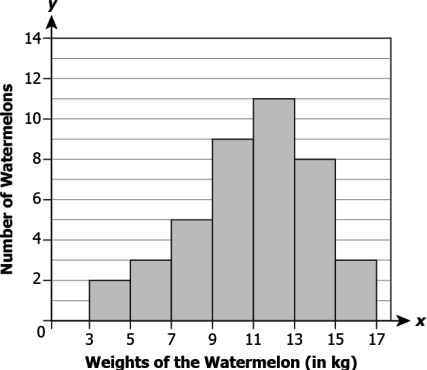
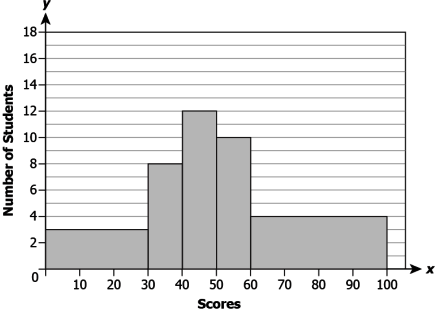
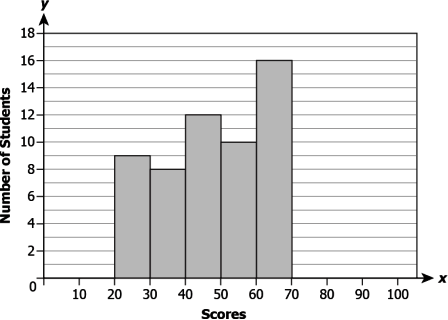
Question.8. The table below shows the quiz scores of a class of students.
(a) 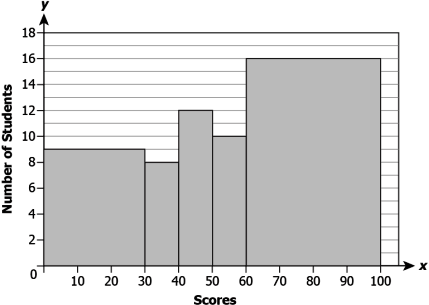
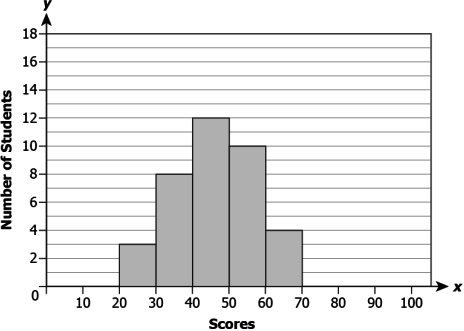
Ans.7. (a)
Question.9. The histogram below shows the number of visitors in a museum on different number of days: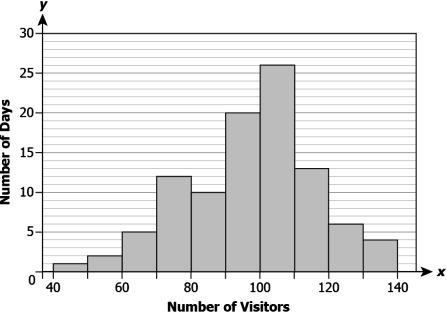
(a) There were about 80-90 visitors for 12 days at the museum.
(b) There were about 60-70 visitors for 5 days at the museum.
(c) There were about 120-140 visitors for 6 days at the museum.
(d) There were about 100-120 visitors for 26 days at the museum.
Question.10. The histogram below shows the daily commute time, in minutes, for 18 employees of an office.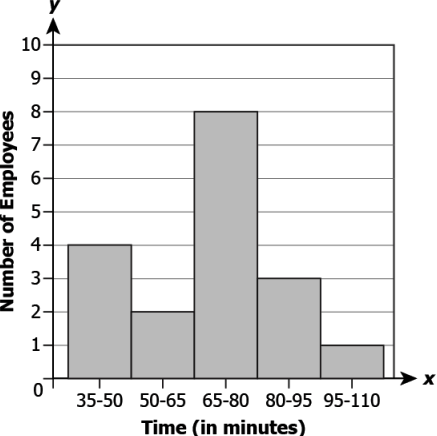
(a) 4 employees take 35-50 minutes to commute to office.
(b) 8 employees take 65-95 minutes to commute to office.
(c) 6 employees take less than 65 minutes to commute to office.
(d) 4 employees take more than 80 minutes to commute to office.
Question.11. Consider the data set shown below:
(a) 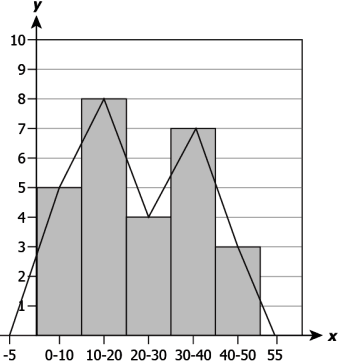
Question.12. The table below shows the points scored by 60 players.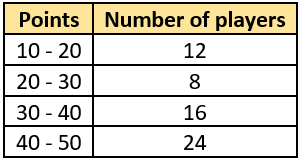
(a) 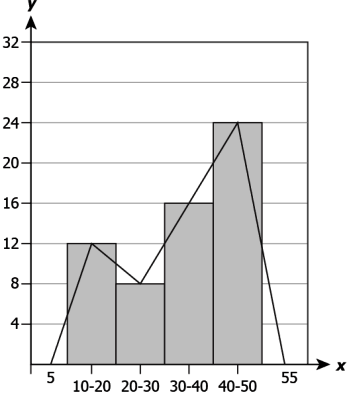
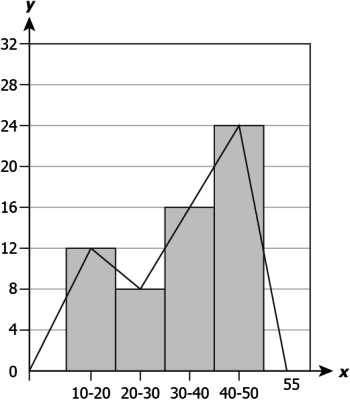
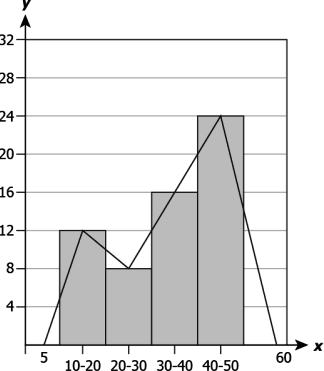
Ans.11. (a)
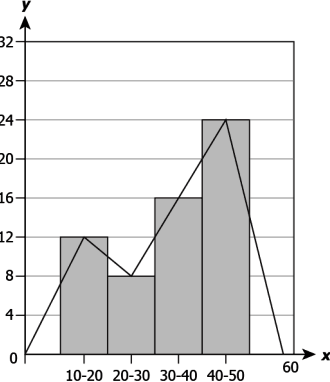
Question.13. The frequency polygon below shows the time, in seconds, taken by 24 students of a class to complete a 100-m dash.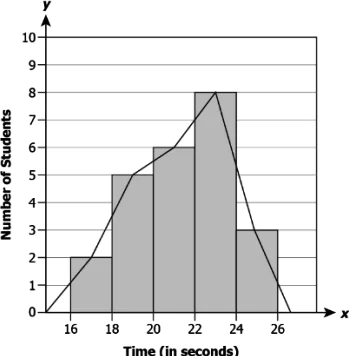
(a) 11 students took 22 or more minutes to complete the 100 m dash.
(b) 2 students took 16-18 seconds to complete the 100 m dash.
(c) 7 students took 16-20 seconds to complete the 100 m dash.
(d) 8 students took 22-26 seconds to complete the 100 m dash.
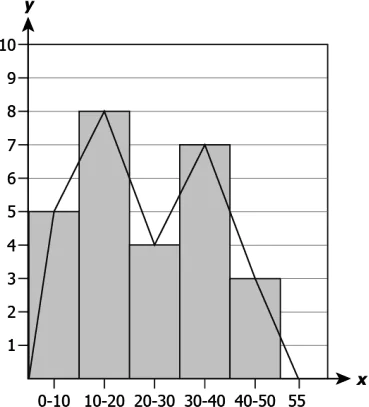
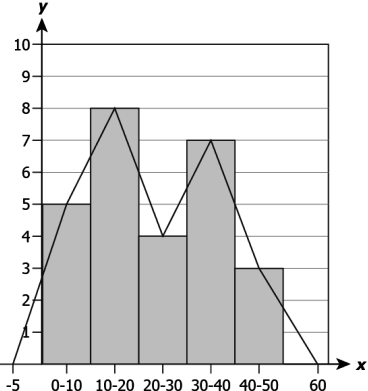
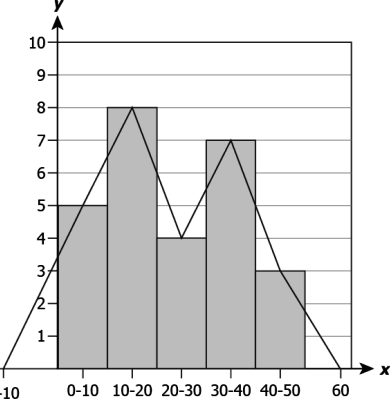
Question.14. The frequency polygon below shows the amount, in cm, of rainfall received on different number of days in a city over a year.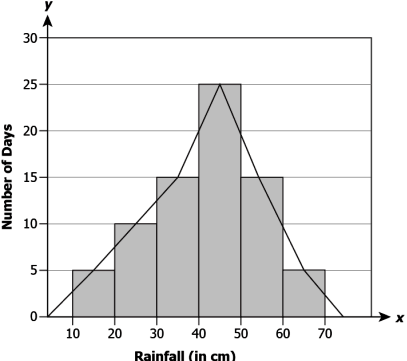
(a) The maximum amount of rainfall received is between 40-50 cm.
(b) The amount of rainfall received was about 10-20 cm for 10 of the days.
(c) The amount of rainfall received was about 50-60 cm for more than 15 of the days.
(d) There were equal number of days when the rainfall was between 10-20 cm and 60-70 cm.
Question.19. Consider the data set shown below.
12, x, 10, 4, 7, 8, 7, 5
If the mean of the given data set is 7, what is the value of x?
(a) 3
(b) 4
(c) 7
(d) 10
Question.20. In the table below, the grocery expenditure of 2 months of a family is missing.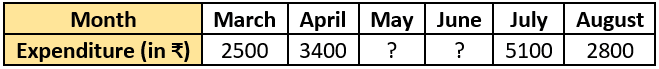
(a) The family spend ₹3800 in May and ₹1900 in June.
(b) The family spend ₹1900 in May and ₹3800 in June.
(c) The family spend ₹3800 in May and ₹7600 in June.
(d) The family spend ₹1900 in May and ₹950 in June.

