
Competency Based Questions for Class 10 Maths Chapter 13 Statistics
Hint: Apply direct method in order to calculate the mean of the grouped data.
Question.1. The table below shows the time taken by a group of students to complete 100 m dash.

Question.2. When calculated using direct method, the mean of the data set shown in the table below is 31. 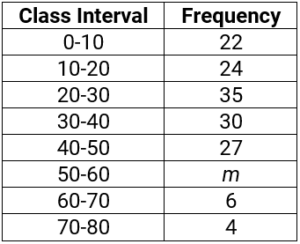
(a) 10
(b) 12
(c) 20
(d) 24
Answer. (b) 12
Hint: Apply assumed mean method in order to calculate the mean for a grouped data.
Question.3. The table below summarizes the data about the heights of students in a class.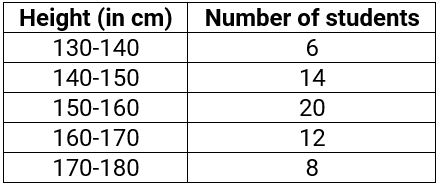
(a) 154.33 cm
(b) 154.67 cm
(c) 155.33 cm
(d) 155.67 cm
Answer. (c) 155.33 cm
Question.4. Amith grows cucumbers in his farm. He collects some of them and measures their lengths and represents his data as shown below.
Which of the following statement is true?
(a) There are a smaller number of cucumbers of length (140 – 150) mm than of length (120 – 130) mm.
(b) There are a smaller number of cucumbers of length (140 – 150) mm than of length (170 – 180) mm.
(c) There are a greater number of cucumbers of length (140 – 150) mm than of length (150 – 160) mm.
(d) There are a greater number of cucumbers of length (140 – 150) mm than of length (130 – 140) mm.
Hint: Compute the mean and mode of the given data in order to interpret the two measures of central tendency.
Question.5. A data set is shown.
(a) Mean: 10; Mode: 10.33
(b) Mean: 10; Mode: 10.67
(c) Mean: 11; Mode: 10.33
(d) Mean: 11; Mode: 10.67
Answer. (d) Mean: 11; Mode: 10.67
Question.6. The table below shows the time taken by a group of 40 students to solve a worksheet.
(a) The mean time taken by the students is more than the sum of time taken by all the students to solve the worksheet.
(b) The time taken by the maximum number of students is less than the mean time taken by the students to solve the worksheet.
(c) The time taken by the maximum number of students is more than the mean time taken by the students to solve the worksheet.
(d) The time taken by the maximum number of students is more than the sum of time taken by all the students to solve the worksheet.
Answer. (b) The time taken by the maximum number of students is less than the mean time taken by the students to solve the worksheet.
Hint: Apply formula for the median of a given grouped data in order to calculate missing values of Frequency.
Question.7. A grouped data is shown below.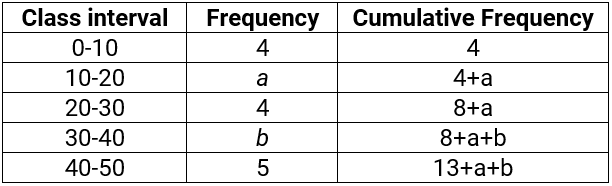
(a) 1
(b) 2
(c) 4
(d) 5
Answer. (d) 5
Question.8. The table below shows the time spent by 100 students on exercising every day.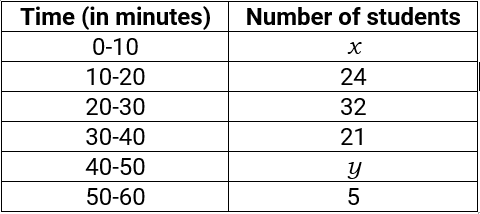
(a) There are twice as many students who exercise 0- 10 minutes each day as the number of students who exercise 40-50 minutes each day.
(b) There are twice as many students who exercise 40- 50 minutes each day as the number of students who exercise 0-10 minutes each day.
(c) There are thrice as many students who exercise 0- 10 minutes each day as the number of students who exercise 40-50 minutes each day.
(d) There are thrice as many students who exercise 40- 50 minutes each day as the number of students who exercise 0-10 minutes each day.
Answer. (b) There are twice as many students who exercise 40- 50 minutes each day as the number of students who exercise 0-10 minutes each day.
Hint: Differentiate between mean, median and mode with examples in order to understand most effective measure of central tendency in various cases.
Question.9. A grouped data is shown below: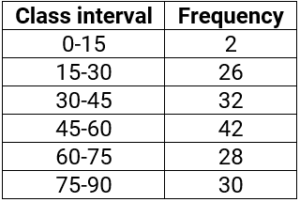
(a) Mean because the data has extreme data points.
(b) Median because the data has extreme data points.
(c) Mean because the data has no extreme data points.
(d) Median because the data has no extreme data points.
Answer. (b) Median because the data has extreme data points.
Question.10. The table below shows the age of people attending a musical concert. 
(a) The central tendency of the data increases by 0.1 as the mean increases by 0.1.
(b) The central tendency of the data increases by 0.1 as the median increases by 0.1.
(c) The central tendency of the data increases by 0.2 as the mean increases by 0.2.
(d) The central tendency of the data increases by 0.2 as the median increases by 0.2.
Answer. (d) The central tendency of the data increases by 0.2 as the median increases by 0.2.
Hint: Derive the co-ordinates to plot on the graph in order to represent the two ogives.
Question.11. The table below shows the heights of plants in Pranay’s backyard.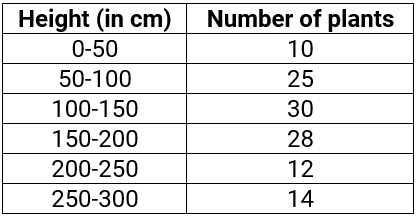
(a) (0, 10), (50, 35), (100, 65), (150, 93), (200, 105), (250, 119)
(b) (10, 0), (35, 50), (65, 100), (93, 150), (105, 200), (119, 250)
(c) (10, 50), (35, 100), (65, 150), (93, 200), (105, 250), (119, 300)
(d) (50, 10), (100, 35), (150, 65), (200, 93), (250, 105), (300, 119)
Answer. (d) (50, 10), (100, 35), (150, 65), (200, 93), (250, 105), (300, 119)
Question.12. The table below shows the age group of 50 women members of a club.
Aruna: (20, 2), (25, 13), (30, 29), (35, 39), (40, 46), (45, 50)
Anjali: (20, 50), (25, 48), (30, 38), (35, 22), (40, 11), (45, 4)
Who is/are correct?
(a) Only Aruna
(b) Only Anjali
(c) Both of them
(d) Neither of them
Answer. (d) Neither of them
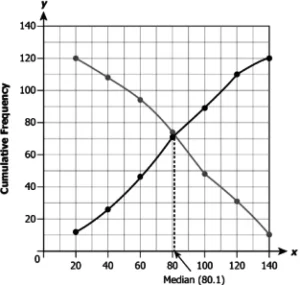
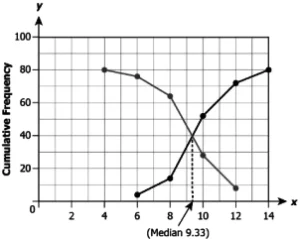
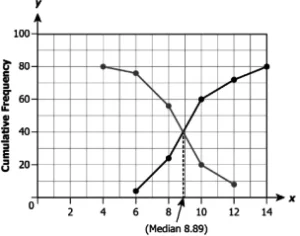
Hint: Graph both ogives for the data obtained in order to determine the median of the given grouped data for.
Question.13. A grouped data is shown below.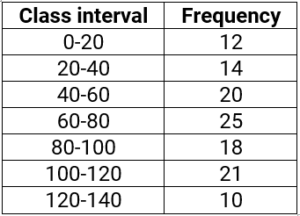
(a)
(b)
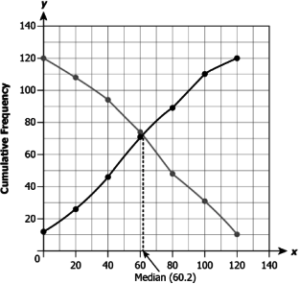
(c)
(d)
Answer. (c)
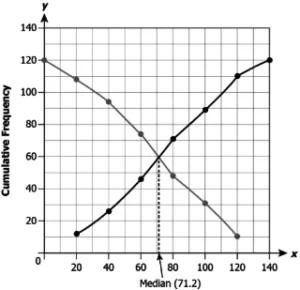
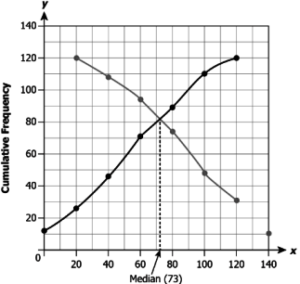
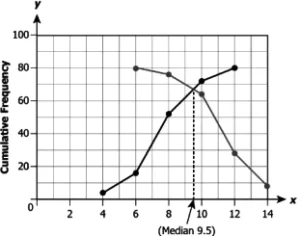
Question.14. The table below shows the number of hours a group of 80 students sleep every day.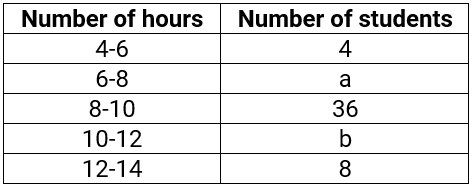
(a)
(b)
(c)
(d)
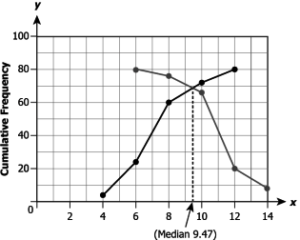
Answer. (a)

